The Economic Merry-Go-Round
A lot of kids that grew up in the 1980’s remember an exciting, but potentially dangerous, playground ride known as the merry-go-round. This ride was typical from the time, in that was exciting group game where inevitably one kid would hang on while their friends would do their best to spin this thing as fast as possible to see if they’d come flying off, protective padding not included… or in existence. I remember discovering Newton’s second law of motion on one of these things; the force required to keep a rider moving in a circle on the merry-go-round is directly proportional to their mass and the square of their speed, and inversely proportional to the radius of the circular path. Put simply, I stuck my foot out while spinning and found myself flung 10 meters across the playground at near the speed of light. I don’t remember much after that.
The economic merry-go-round is the business cycle, as defined by Investopedia, that refers to economic fluctuations between periods of expansion and contraction. Factors such as gross domestic product (GDP), interest rates, total employment and consumer spending can help determine what current economic cycle stage we find ourselves in. This economic cycle can be as exciting and perilous as the merry-go-round if you aren’t careful, but it can be less risky than my aforementioned experience if safeguards are used.
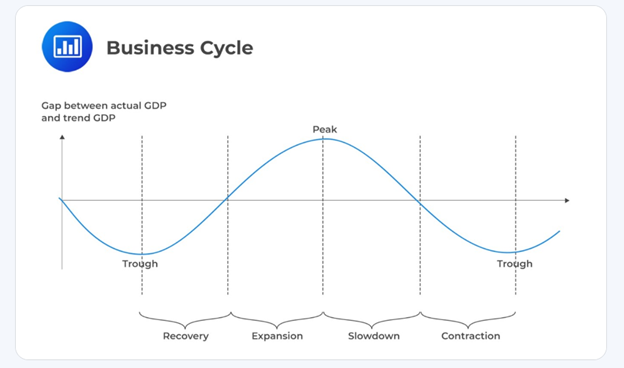
The graph below shows the cycle’s four different stages: recovery, expansion, slowdown and contraction. Each stage has different indicators to help us determine where we are in the cycle and how we can avoid being flung from the markets in dramatic fashion.

Source: Analyst Prep
As of the beginning of 2025, most economists believe we are in the slowdown (or late-stage) phase of the business cycle. This means the economy has been growing for a while, with indicators like low unemployment and high consumer confidence. We’ve mentioned in the past that you have to be careful when following the crowd but, in this case I agree. The issue is when do we move from slowdown to contraction?
Economic cycles are not an exact science, but we can get an idea as to where we are, based on the data. Sector rotation is an indicator of this, as investors have started moving money from cyclical sectors like technology and consumer discretionary stocks to more defensive sectors like utilities and consumer staples. Fidelity has a great interactive graphic to give people an idea as to where we are in the cycle. You can look at different countries to see their place in the cycle or all at the same time to see where major economies are in relation to each other.
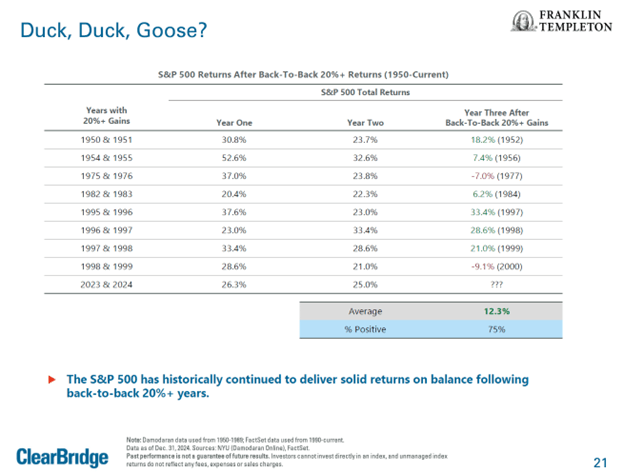
An anecdotal indicator of this is also the number of times our team gets asked if there is a market crash coming, which can indicate anxiety in investors after having it good for a number of years in a row. Feelings are not always reality however, as back-to-back annual gains of over 20% for the S&P 500 do not make U.S. equities necessarily due for a pullback. History shows the market has typically continued to deliver solid, albeit more muted, returns in the following year. From 1950, seven of nine times we’ve seen two years of more than 20% returns, the third year was positive, with an average return of 12.3%. The table below from Franklin Templeton shows this history in detail.

As mentioned in our previous articles, you can be in an economic stage longer than you think. If you reference The Prophecy of Economic Cycles, we discuss the probabilities surrounding predictions. We also spoke in our article Bubblicious, about how even if you know things are moving in a certain direction (i.e., pull-back or recession), markets can go in your favour longer than you think they will. This is why it’s important to stay invested, diversified and flexible in your approach. This brings me back to safeguards in a portfolio. Because no one can know the future, we increase our buffer of cash and equivalents while still owning equities.
This newsletter has been prepared by Stephen Maser of Raymond James Ltd. (“RJL”). It expresses the opinions of the writer, and not necessarily those of RJL. Statistics, factual data and other information are from sources believed to be reliable but accuracy cannot be guaranteed. It is furnished on the basis and understanding that RJL is to be under no liability whatsoever in respect thereof. It is for information purposes only and is not to be construed as an offer or solicitation for the sale or purchase of securities. RJL, its officers, directors, employees and their families may from time to time invest in the securities discussed in this newsletter. This provides links to other Internet sites for the convenience of users. Raymond James Ltd. is not responsible for the availability or content of these external sites, nor does Raymond James Ltd endorse, warrant or guarantee the products, services or information described or offered at these other Internet sites. Users cannot assume that the external sites will abide by the same Privacy Policy which Raymond James Ltd adheres to. It is intended for distribution only in those jurisdictions where RJL is registered as a dealer in securities. Distribution or dissemination of this newsletter in any other jurisdiction is strictly prohibited. This newsletter is not intended for nor should it be distributed to any person residing in the USA. Raymond James Limited is a Member Canadian Investor Protection Fund. Raymond James (USA) Ltd. (RJLU) advisors may only conduct business with residents of the states and/or jurisdictions for which they are properly registered. Raymond James (USA) Ltd., member FINRA/SIPC.

